
As hospitals merge into larger trusts there becomes a centralisation of some services. Interventional radiology (IR) has been one of those services. Our district general hospital runs bi-weekly lR lists following service centralisation.
Urology and IR most commonly liaise on two procedures – percutaneous nephrostomies (PCN) and antegrade ureteric stent (AUrS) insertions. The National Institute for Health & Care Excellence (NICE) and European Association of Urology (EAU) 2019 guidelines consider either nephrostomy or antegrade stents as appropriate interventions for de-obstruction in the emergency and elective setting [1,2]. Nephrostomies are generally quicker and simpler procedures, but the complications rates are higher and they are more expensive [3].
Junior members of the team raised concerns over the delay in getting an IR procedure. Concerns were raised at a governance meeting, and it was agreed, on several occasions, that patients were waiting for IR procedures for a prolonged period, hence resulting in delayed discharge and bed blocking. The quality issue raised was with regards to clinical effectiveness [4], and its impact on patient safety. The aim of this project was to use the define, measure, analyse, improve, and control (DMAIC) [5], sigma six methodology to improve potential delays in patient care. We aimed to maximise the utilisation of the bi-weekly lists through innovation, improved communication, and appropriate prioritisation of patients.
"The aim of this project was to use the define, measure, analyse, improve, and control (DMAIC) [5], sigma six methodology to improve potential delays in patient care."
Data was collected over a four-month period. Delay to procedure was the primary measure. There was also an assessment of the opinions of key stakeholders (the urology team and the IR team) and observations to measure time delays at individual stages of processes. As there is no national standard on time to nephrostomy, an internal target was created for these non-life threatening, emergency cases. It was expected that the IR procedures were done on the next available list from time of booking – therefore a target of “less than 3.5 days” was expected.
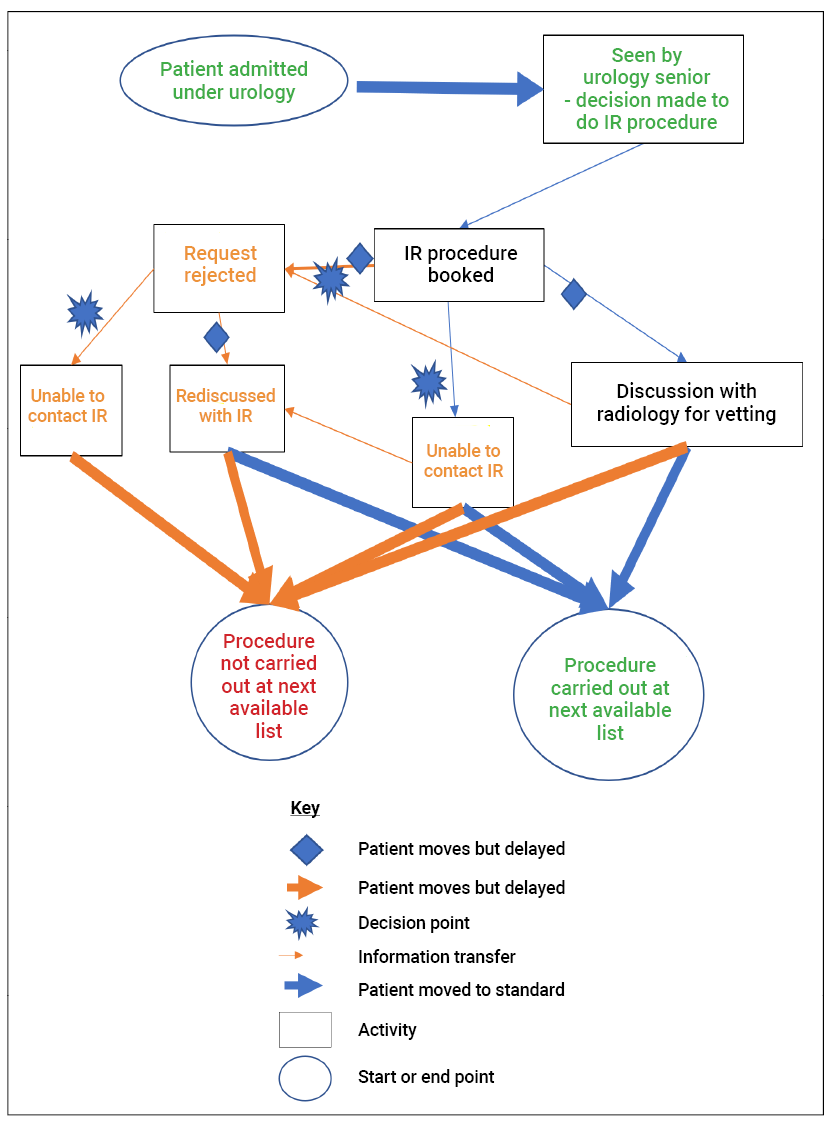
Figure 1: Value stream map of the current state and a key. The map begins with a patient being admitted under urology and ends with the procedure occurring at the next available list, or not. Each step has a value to someone (patient / doctor) or something (system). Value is dependent on the individual that assigns it. From the patient’s perspective, added value is shown in green, what one may consider as valuable for the patient could be decisions and action. What is in grey and green may be considered valuable for the staff. The vetting process and rejection of scans might be considered as value added to the system to prevent unnecessary scan requests or procedures being carried out.
A qualitative and quantitative analysis was carried out. A value stream mapping (Figure 1) analysis was performed, combined with focused interviews and fishbone analysis formed the basis of a future state map (Figure 2).
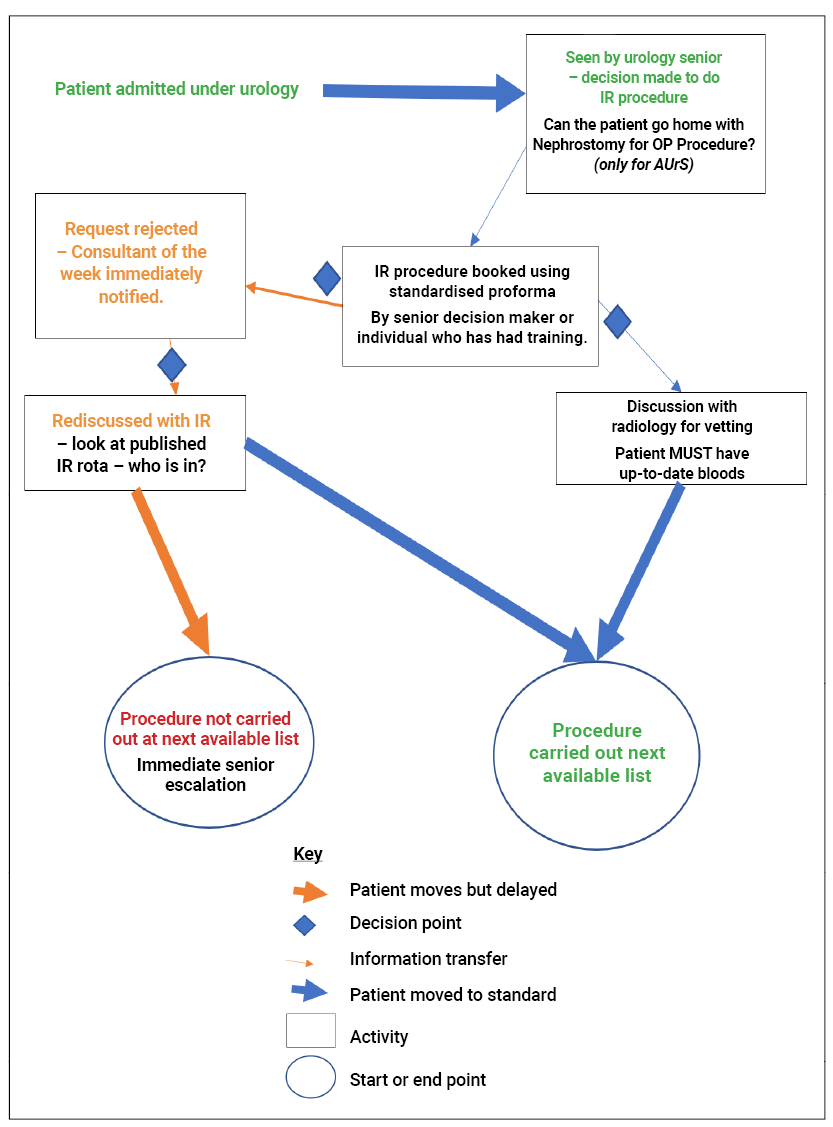
Figure 2: Proposed future state map. All processes involved have been deemed required for the pathway to work. Parameters have been placed on processes to ensure they are reliable. Compared to the current state map, two pathways lead to the procedure being carried out and only one to the procedure not. There are less bottlenecks and there is a clear line of communication.
Prior to the intervention, the average wait for IR was 3.66 days. Higher than our set agreed standard of 3.5 days (Figure 3a and b). A systematic analysis of the current state of the system followed data gathering. Thematic analysis outlined lack of standardisation. We noted bottlenecks through mapping which resulted predominately from lack of communication (Figure 1).
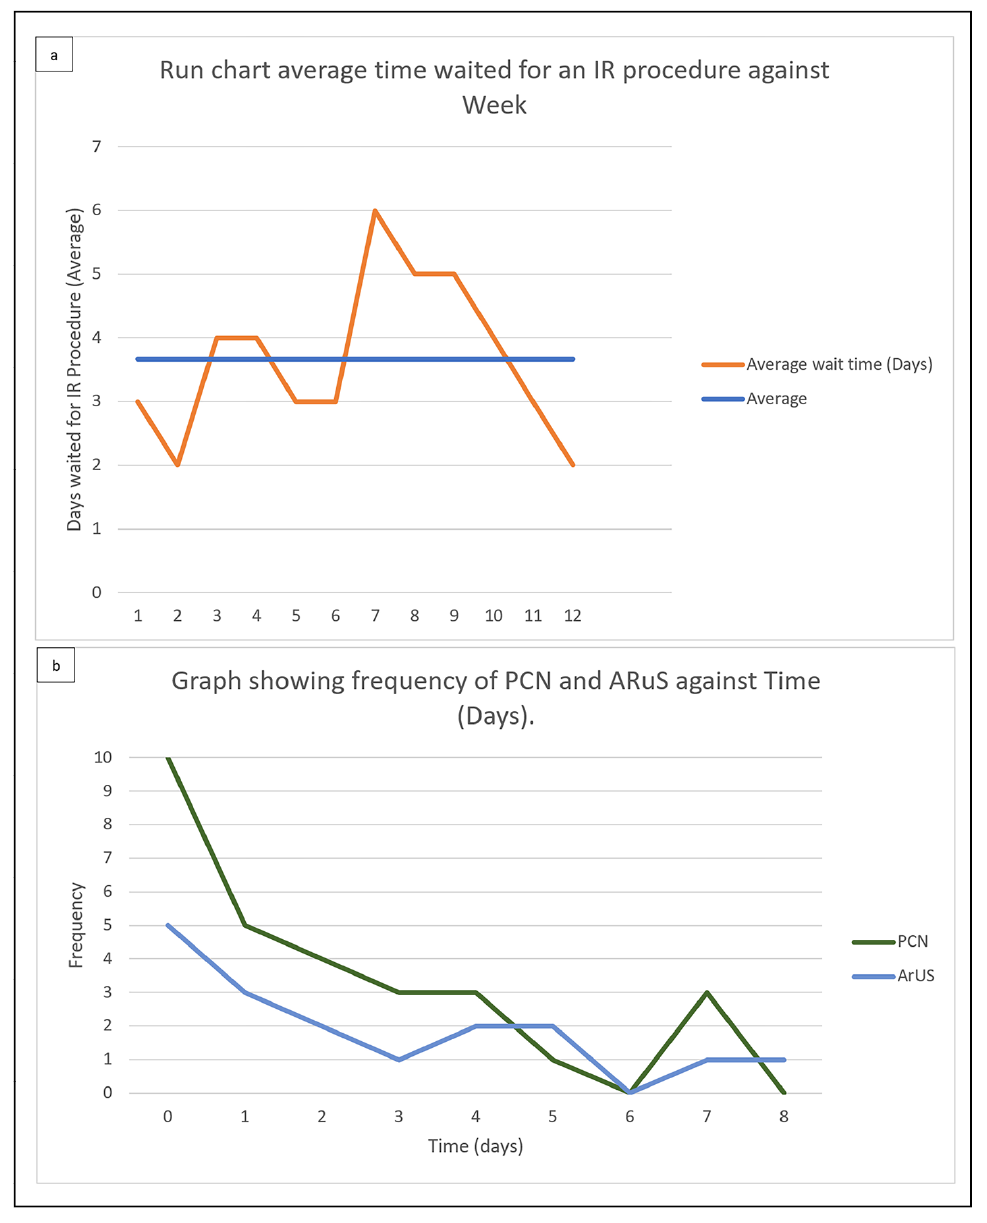
Figure 3a: Run chart showing the average number of days waited for an IR procedure against weeks when measurements started. The average time spent for a patient waiting an IR procedure was 3.66 days. 35/46 procedures due to uro-oncological obstruction (prostate cancer most commonly), the average age was 73. The data shows patients waiting longer than the next available list which is on average 3.5 days from request 50% of weeks. Figure starts when the procedure was booked, e.g., patient admitted and procedure booked on Tuesday and procedure carried out on Tuesday = 0 days. One delayed week (week 7) causes a backlog onto the system which is only rectified after 5 weeks (week 12). When there are no significant delays, as seen in the first 6 weeks, the system runs smoothly.
Figure 3b: The frequency against time (taken for an IR procedure to be done) in days. It is important to note some negative deviants and variation in both PCN and AUrS. This is reflected in the average seen in Figure 3a. Most procedures were done on day 0 or 1, but there were several procedures done on day 5, 7 and 8 which effected the average. Understandably, more PCNs were done on day 0 as they are often more pressing.
The analysis outlined organisational factors, such as rota publishing issues together with lack of protocols and escalation clarity. The analysis showed there is opportunity and scope for change and gain in the current system. The following changes (as controls) were made based on the measurements and comprehensive analysis (implemented in a future state map -Figure 2):
- Standardisation of communication regarding PCN and AUrS between urology and radiology.
- IR consultant rota and contact number published.
- Teaching session for urology junior doctors in the basic clinical details required on request forms and need for up to date blood tests / ward preparation of the patient.
- Registrar recommended to book PCN and AurS / discuss with IR as necessary.
- Consultant of the week immediately notified if scan is rejected so they can escalate request.
Post-intervention showed average patient wait had reduced to 1.54 days, re-audit results can be seen in Figure 4.
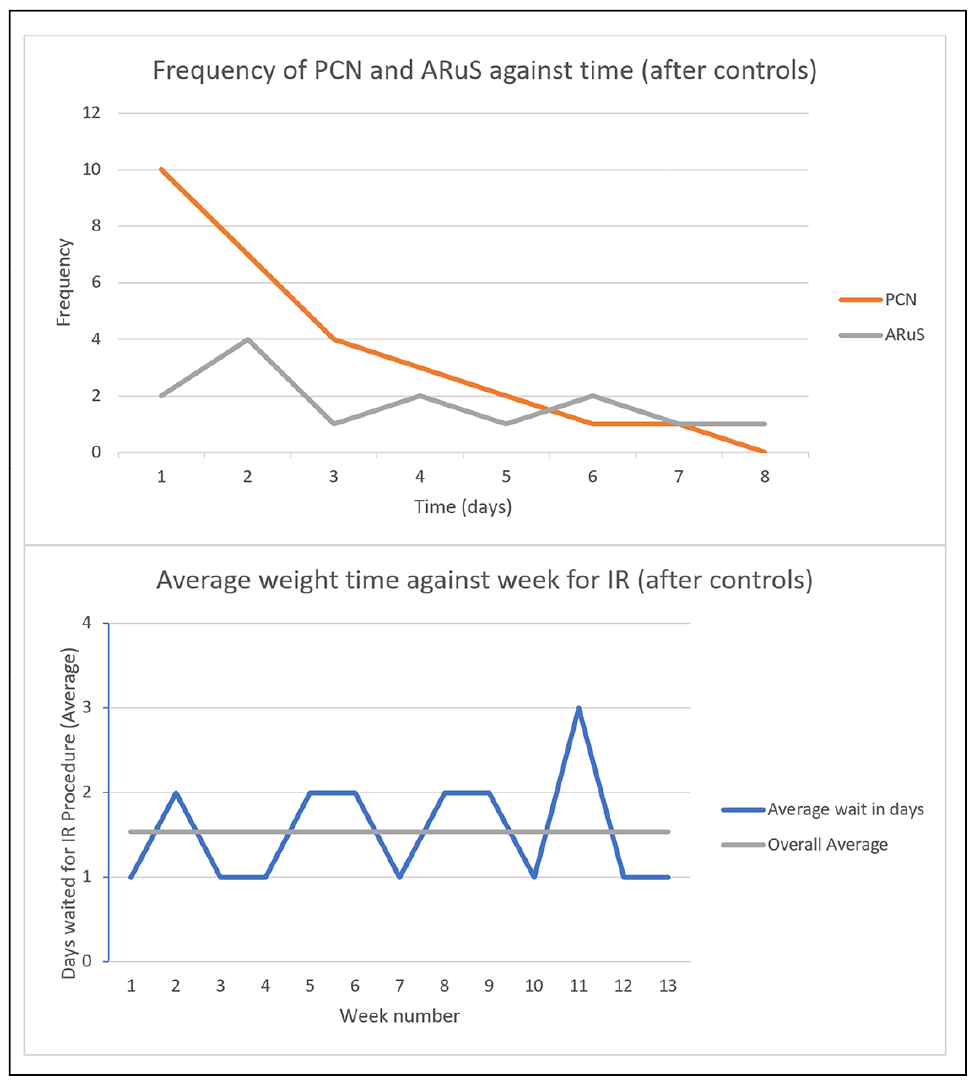
Figure 4: The frequency of days against the time waited (top). The mode and range are less than before the control. The bottom figure is the run change of average time waited per week. The overall average is 1.54 days which is less than the agreed standard of 3.5 days and less than before the control.
The DMAIC method proved a comprehensive assessment of improvement. Patient waiting times can be reduced in hospitals with similar experience using such methods. Future Plan-Do-Study-Act can be used to continually improve outcomes.
References
1. NICE. Acute kidney injury: prevention, detection and management: Guidance and guidelines. 2019
https://www.nice.org.uk/guidance/cg169.
2. Turk C, Skolarikos A, Neisius A, et al. EAU Guidelines on Urolithiasis. European Association of Urology 2019
https://uroweb.org/guidelines/urolithiasis.
3. Hausegger KA, Portugaller HR. Percutaneous nephrostomy and antegrade ureteral stenting: technique, indications, complications. European Radiology 2006;16(9):2016.
4. Darzi A. NHS next stage review: interim report. COI for the Department of Health 2007.
5. NHS Improvement. An Overview of Six Sigma. 2011
https://www.england.nhs.uk/improvement-hub/wp-content/uploads/
sites/44/2018/06/An-overview-of-Six-Sigma.pdf
All links last accessed 13 July 2023.