Introduction
Prostate cancer remains the most commonly diagnosed cancer in males and the second leading cause of cancer related deaths in UK men, after lung cancer [1]. The incidence of prostate cancer in the UK has shown a rapid increase in recent years, partly due to early diagnosis with serum prostate specific antigen (PSA) testing. Prostate cancer now accounts for a quarter of all new cancer cases in men. Despite these statistics, prostate cancer has a relatively good prognosis with an average one-year survival rate of 94% and an average five-year survival rate of 81% [1].
Diagnosis of early disease, with accurate localisation and staging has aided the delivery of effective, minimally invasive therapies leading to good outcomes and less morbidity. Magnetic resonance imaging (MRI) of the prostate is a useful and accurate tool in the localisation and staging of prostate cancer. Initially, this technique was only recommended in patients with a high clinical suspicion of cancer despite negative transrectal ultrasound and biopsy findings. However, with standardisation of imaging protocols and advancements in functional imaging, prostate MRI has become widely used in guiding treatment for patients with biopsy-proven cancer, and even more recently to guide biopsy in those with suspected cancer.
Imaging protocols
Prostate MR can be performed with either a standard pelvic phase-array coil on a mid to high field strength magnet (at least 1.5T) or in conjunction with an endorectal coil. Multi-planar sequences with a small field of view (FOV) achieve good quality images with optimal spatial resolution and an improved signal to noise ratio [2]. Most standard MR protocols for imaging the prostate include a larger field of view axial T1-weighted (T1W) sequence to look for local lymph node metastases and bony disease. T1W images are also useful in distinguishing post-biopsy haemorrhage within the prostate gland and seminal vesicles from tumour infiltration. Small FOV axial, coronal and sagittal T2-weighted (T2W) sequences are also obtained. T2-weighting is better at delineating zonal anatomy and capsular margins, and is therefore most useful for tumour localisation within the prostate and determining extracapsular extension (ECE) [3]. These standard sequences are being increasingly supplemented with dynamic post-contrast imaging and diffusion-weighted imaging to enhance accuracy in tumour detection. Additionally, coronal T2W images of the abdomen (abdominal survey) and sagittal T1W of the spine are also commonly included to look for bony, as well as distant metastases.
Normal prostate anatomy on MRI
The normal prostate gland demonstrates intermediate to low signal intensity on T1-weighted imaging [4]. There is insufficient soft-tissue contrast resolution on the T1W images to distinguish the intraglandular architecture and therefore this sequence is not used for tumour localisation (Figure 1).
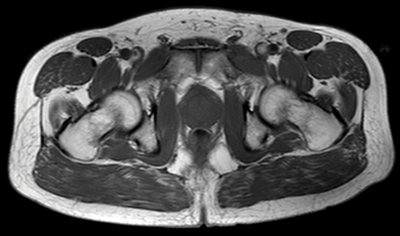
Figure 1: Axial T1 image showing homogeneous low signal appearance of the prostate.
On T2-weighted images, the normal peripheral zone demonstrates homogeneous high signal intensity. The outer margin of the peripheral zone is demarcated by a thin rim of low signal intensity, which represents the true prostate capsule. The neurovascular bundles are low-signal intensity structures seen posterolateral to the true capsule and are surrounded by high-signal fat [4] (Figure 2).
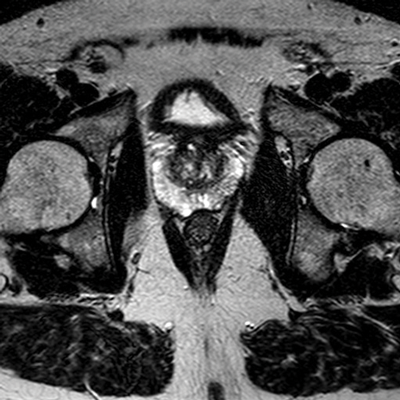
Figure 2: Axial T2 image showing high signal peripheral zone
and low signal capsule and heterogenous central zone.
It is difficult to distinguish the transitional zone from the central zone on MRI, and these are usually described radiologically as a collective ‘central zone.’ The central zone is normally hypo-intense on T2W, although this is variable. Benign conditions such as benign prostatic hyperplasia (BPH) may give a heterogeneous appearance to the central gland with low to intermediate signal intensities. A low-signal intensity rim also surrounds the central zone, often referred to as the surgical pseudocapsule [2]. The vas deferens and seminal vesicles, being fluid-filled structures, normally demonstrate high signal intensity on T2W images.
Appearances of prostate cancer on MRI
Seventy percent of prostate adenocarcinomas arise in the peripheral zone [4]. On T2-weighted images, prostate cancer appears as a low signal intensity area within the normally hyper-intense peripheral zone (Figure 3).
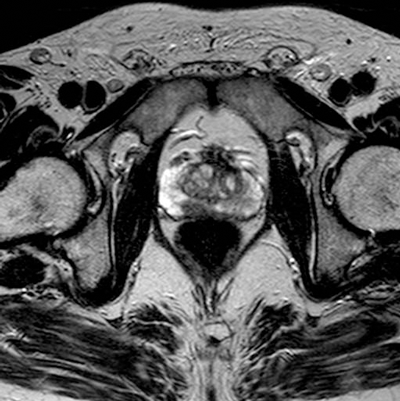
Figure 3: Axial T2 image showing area of low signal in the right peripheral zone in keeping with tumour.
Peripheral zone low signal, however, can occur in a variety of conditions, such as haemorrhage, prostatitis, benign hyperplastic nodules, or post-treatment change [4]. Post-biopsy haemorrhage, in particular can be an important confounding variable, and may hamper tumour detection. T1-weighted imaging plays an important role, as haemorrhage demonstrates high signal intensity on the T1W images, whereas tumour demonstrates low signal intensity on T1W. Generally a delay of six to eight weeks post-biopsy is also recommended to allow for resolution of haemorrhage. Dynamic contrast enhanced imaging and diffusion-weighted imaging (DWI) can also aid in distinguishing tumour from benign conditions.
Although MR is most accurate in the detection of peripheral zone tumours, central / transitional zone tumours should also be actively considered, especially in patients with rising PSA and multiple negative transrectal biopsies [2]. Given the commonly heterogeneous appearance of the central gland, MR interpretation may be difficult, but the presence of the following may aid diagnosis: homogenous low signal intensity in the central zone (especially in the absence of an obvious peripheral zone tumour), poorly defined or speculated margins, absence or interruption of the low-signal pseudocapsule or urethral invasion (Figure 4) [2].
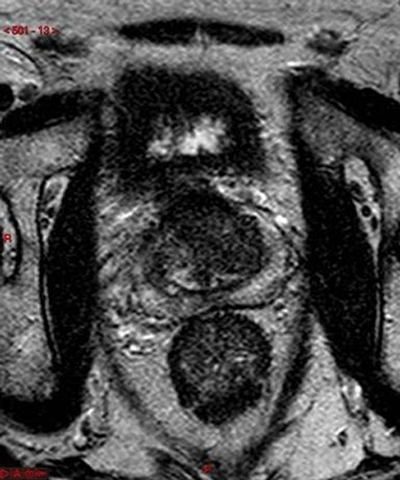
Figure 4: Axial T2 image showing diffuse low signal in the left central zone.
In addition to tumour localisation, MR plays a vital role in the local staging of disease, namely the differentiation of organ-confined disease (T1 and T2) from locally advanced disease with extracapsular extension and seminal vesicle invasion (T3).
T3a disease
Extracapsular extension (ECE) denotes T3a disease, which has important implications with regards to treatment, as radical prostatectomy may not be curative and radiotherapy +/- hormone treatment is often considered [5]. Accurate diagnosis of ECE is therefore crucial, and depending on technique, MRI has shown up to 90% accuracy in detecting extraprostatic tumour extension [3]. Diagnostic criteria with a high specificity (>90%) include: asymmetry of the neurovascular bundle, obliteration of the rectoprostatic angle, and direct tumour extension outside of the capsule (Figure 5) [3].
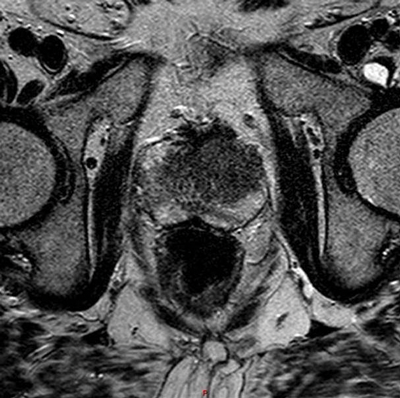
Figure 5: Axial T2 image showing left sided T3a disease with tumour seen outside the capsule.
More subtle criteria are often used; however microscopic ECE does not affect survival rates and may not influence management.
T3b disease
Seminal vesicle involvement (SVI) denotes T3b disease, and is another important prognostic indicator as it is associated with a high rate of treatment failure and lower survival rates [4]. Tumour infiltration of the seminal vesicles appears as a low signal intensity area within the normal high signal intensity fluid of the seminal vesicles on the T2W images [3]. Asymmetry of the seminal vesicles, obliteration of the angle between the base of the prostate and the seminal vesicles, and low-signal intensity within enlarged ejaculatory ducts may also indicate involvement (Figure 6) [2].
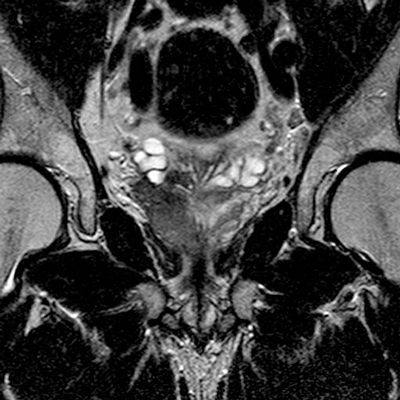
Figure 6: Coronal T2 image showing extensive right peripheral zone
tumour with extension into the base of the right seminal vesicle.
T4 disease
T4 disease is spread of tumour into adjacent tissues other than seminal vesicles, such as bladder, rectum or pelvic side-wall. Invasion is demonstrated by loss of the fat plane between the tumour and the structure, or in cases of more aggressive disease, visualisation of tumour within that structure (Figure 7) [3]. The sagittal T2W sequence is particularly useful at identifying bladder and rectal invasion [4].
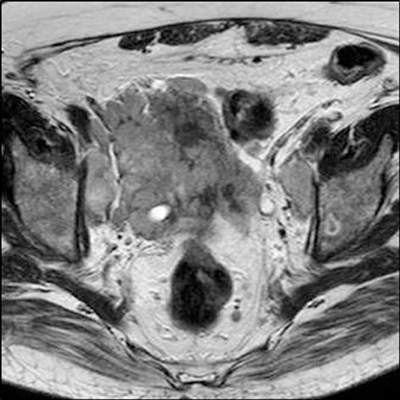
Figure 7: Axial T2 showing extensive prostate tumour invading the bladder and bilateral iliac lymph nodes.
Lymphadenopathy and distant metastases
Large FOV axial T1W images are most useful for identifying local adenopathy. Criteria similar to those used in CT staging are often applied to MR to define clinically significant nodal involvement. Enlarged, spherical lymph nodes measuring at least 1cm in short axis dimension with loss of normal internal architecture are considered significant (Figure 7). Large FOV multiplanar T2W images of the abdomen and pelvis may be acquired to look for distant nodal disease or distant organ involvement. This is used in conjunction with CT, particularly in stage III or IV disease and when considering pre-treatment lymph node sampling [7]. T1 images should be evaluated to assess for bone metastases and will be seen as low signal intensity compared with the normal high signal marrow fat.
Conclusion
Prostate MRI provides superior anatomical visualisation of pelvic structures, enhancing detection of cancer and assisting in tumour characterisation and local staging. Standardised imaging protocols and systematic review of specific indicators allows accurate diagnosis of organ-confined versus locally advanced disease, as well as distant metastatic spread. The application of multi-parametric MRI and functional imaging has further improved MRI accuracy and will be discussed in our next article.
References
1. Prostate cancer statistics. Accessed from
www.cancerresearchuk.org
2. Hricak H, Choyke PL, Eberhardt SC, et al. Imaging Prostate Cancer: A Multidisciplinary Perspective. Radiology 2007;243(1):28-53.
3. Kundra V, Silverman PM, Matin SF, et al. Imaging in Oncology from The University of Texas M. D. Anderson Cancer Center: Diagnosis, Staging, and Surveillance of Prostate Cancer. AJR Am J Roentgenol 2007;189(4):830-44.
4. Claus FG, Hricak H, Hattery RR. Pretreatment evaluation of Prostate Cancer: Role of MR Imaging and 1H MR Spectroscopy. Radiographics 2004;24(Suppl 1):S167-80.
5. Prostate Cancer: Treatments by Stage. Accessed from
www.webmd.com/prostate-cancer/
guide/treatments-by-stage
6. Venkitaraman R, Cook GJ, Dearnaley DP, et al. Does magnetic resonance imaging of the spine have a role in the staging of prostate cancer? Clinical Oncology 2009;21(1):39-42.
7. Cheuck L, Ghiraldi EM, Atalla CS. Prostate Cancer Diagnosis and Staging. Accessed from
http://emedicine.medscape.com
Part 2 of this study can be found here