Clinical Trials 2 is available here.
Case 1

1. What are the levels of clinical evidence based on the 2009 definitions from the ‘Oxford CEBM’?
2. What is the null hypothesis?
3. What are type 1 and type 2 errors?
4. What is meant by ‘power’ in clinical trials?
Case 2
A new diagnostic blood test for prostate cancer has been examined in a clinical trial of 150 patients. The data for its effectiveness in establishing a diagnosis of prostate cancer is shown:
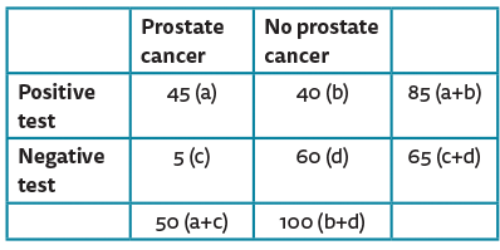
1. What do sensitivity and specificity mean?
2. Calculate the sensitivity and specificity of this new blood test?
3. What is its positive predictive value?
4. What is its negative predictive value?
Case 3
The following images are used to help represent statistical results from clinical trials in a reader friendly manner.
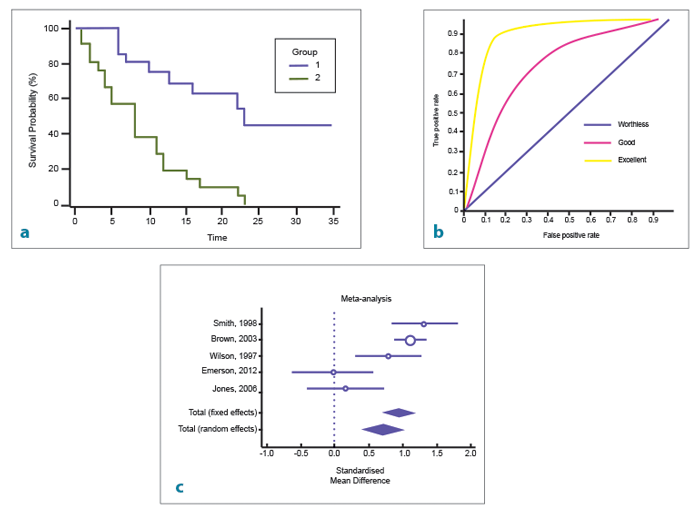
1. What type of curve is seen in image a? What outcome factor is commonly compared?
2. What type of curve is seen in image b? What does the area under the curve represent?
3. What type of curve is seen in image c? When is it commonly used?
Clinical trials 1 Answers
Case 1
1.
1a Systematic reviews of randomised controlled trials.
1b Individual randomised controlled trials.
1c All or none randomised controlled trials.
2a Systematic reviews of cohort studies.
2b Individual cohort study or low quality randomised controlled trials (e.g. <80% follow-up).
2c ‘Outcomes’ research; ecological studies.
3a Systematic review of case-control studies.
3b Individual case-control study.
4 Case series (and poor quality cohort and case-control studies).
5 Expert opinion without explicit critical appraisal, or based on physiology, bench research or ‘first principles’.
2. The null hypothesis refers to a statement that there is no relationship between two measured variables. Therefore rejecting the null hypothesis means there is a relationship between the studied variables.
3. Type 1 error is the incorrect rejection of a true null hypothesis (‘false positive’). Type 2 error is incorrectly retaining a false null hypothesis (‘false negative’).
4. Power analysis is used to calculate the minimum number of patients needed to be recruited to a study so that it can be reasonably likely to detect an effect.
Case 2
1. Sensitivity measures the proportion of positives that are correctly identified (e.g. percentage of prostate cancer patients who are correctly identified by this test). Specificity measures the proportion of negatives that are correctly identified (e.g. percentage of non-cancerous patients who are correctly identified).
2. Sensitivity = a/(a+c) 45/50=90%. Specificity = d/(b+d) 60/100=60%.
3. PPV=a/(a+b) 45/85=53%.
4. NPV=d/(c+d) 60/65=92%.
Case 3
1. Kaplan-Meier survival plot. This is often used to highlight when a patient in a clinical trial reaches a specific event or endpoint, e.g. recurrence, metastasis, death.
2. Receiver operating characteristic (ROC) curve. This is an effective method for assessing the performance of a diagnostic test. The area under the curve represents the effectiveness of a test. An area under the curve of 1 represents a perfect test, an area of 0.5 represents a worthless test.
3. Forest plot. It displays the results from a number of scientific studies, along with the overall combined results. It is commonly used for graphical representation of the results from a meta-analysis of randomised controlled trials.