Following on from the first two parts of this series (see Part 1 here, and Part 2 here), this final article aims to demonstrate how the theory of statistics applies to medical diagnostics.
Probability in diagnostic testing
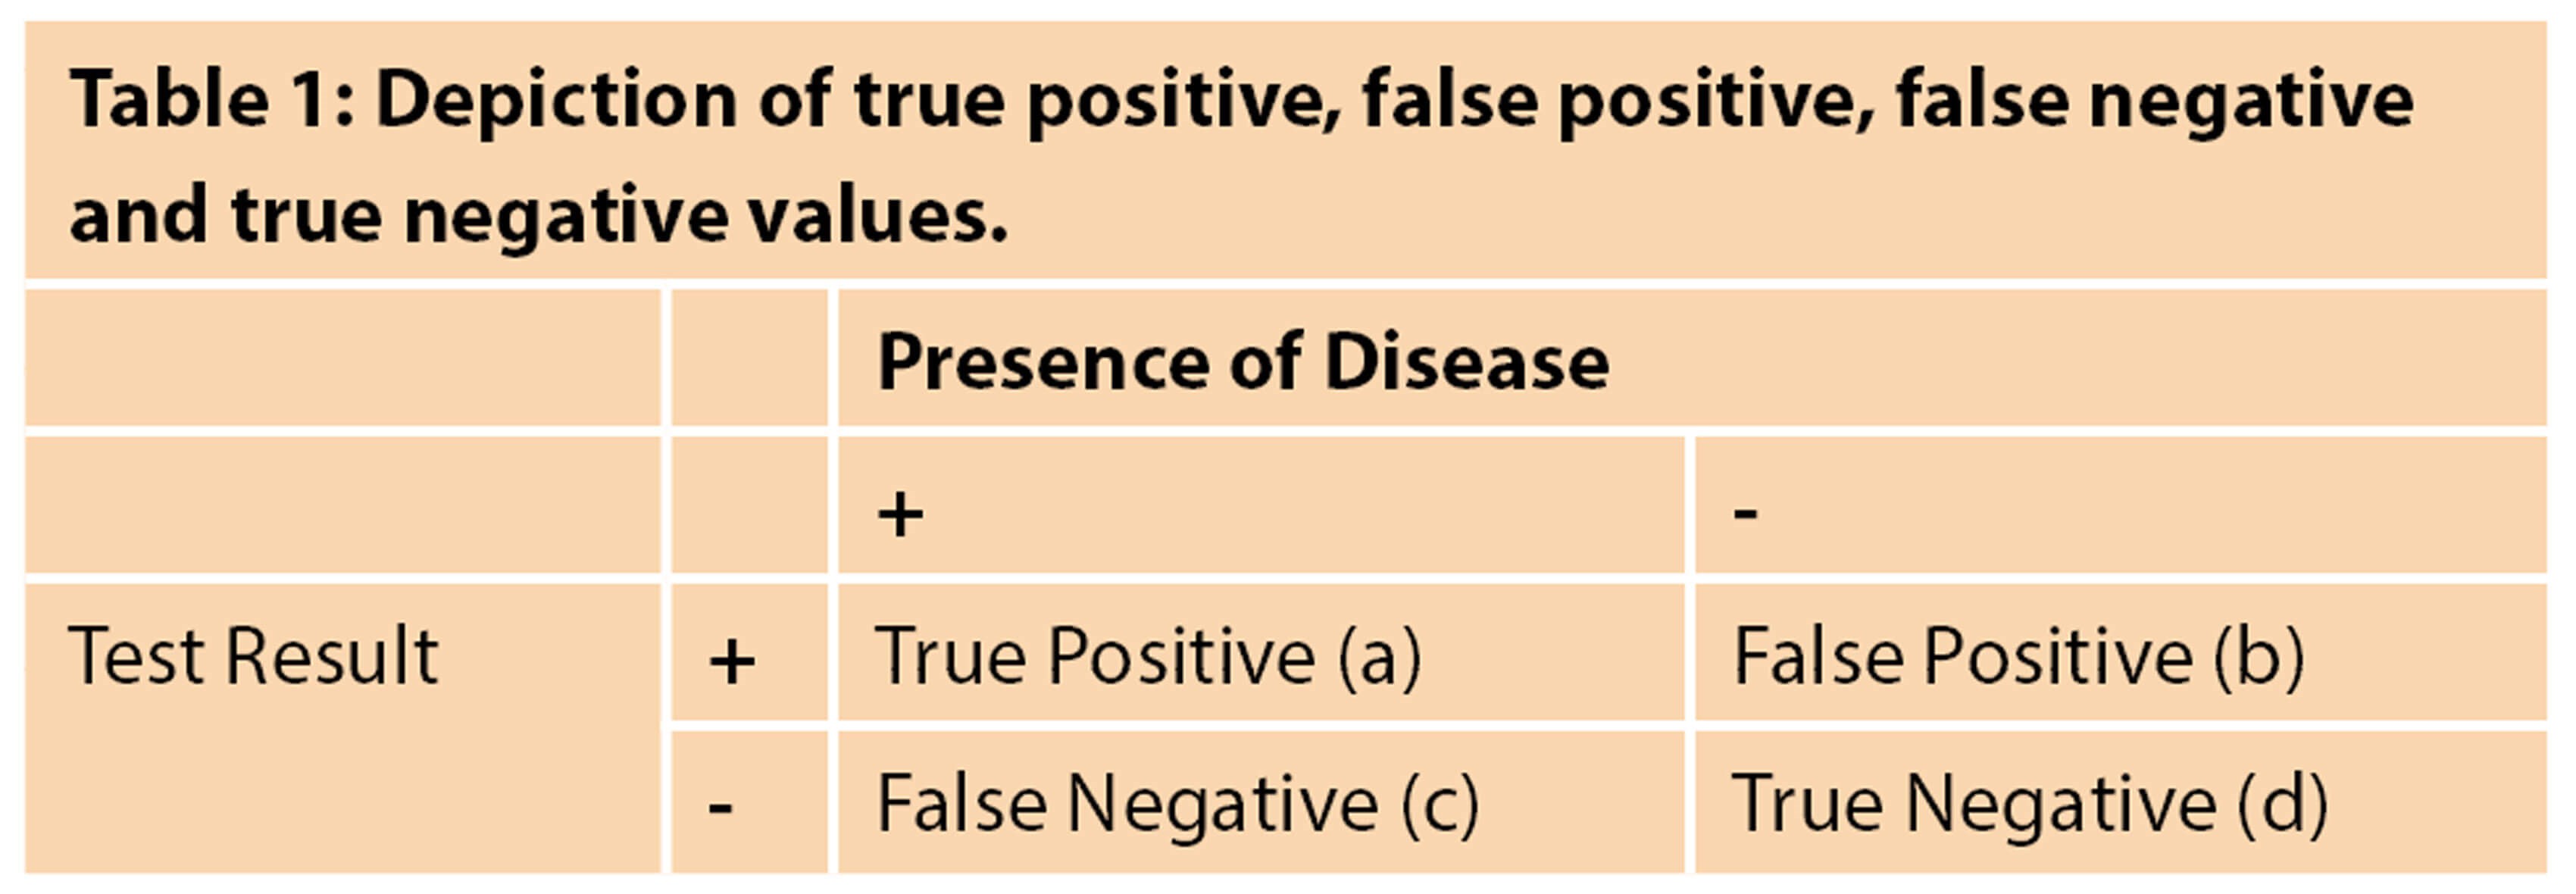
Diagnostic tests refer to any means of assessing the likelihood of a patient’s disease status including tests and investigations. Despite being key to making clinical decisions, these diagnostic tests are prone to error, which clinicians must be aware of. A diagnostic test can have two outcomes, it can be positive or negative. A perfect diagnostic test would give a positive result only when the patient has the disease and a negative result only when the patient doesn’t have the disease however diagnostic tests are not entirely accurate. When considering the accuracy of a diagnostic test, it is vital to be aware of sensitivity and specificity, as well as positive predictive value and negative predictive value. Understanding these values can determine whether a diagnostic test is appropriate to be conducted. These can be best displayed in a 2x2 table as shown in Table 1 [1].
Sensitivity refers to the proportion of people who get a positive test result when they do have a certain disease, or in other words, the ability to identify true positive patient pathology correctly. For example, suppose a diagnostic test has 95% sensitivity. In that case, this means that of all the people who have the disease, only 95% of people will have a positive diagnostic test result, and 5% of people will have their disease missed, also known as a false negative. The following equation can be used to work out sensitivity:
Sensitivity = (True Positives (a)) / (True Positives (a) + False Negatives (c)) x 100
Highly sensitive tests can be helpful as screening tests as they will be unlikely to miss out people who do have the disease.
Specificity, on the other hand, refers to the proportion of people who get a negative test result when they do not have a certain disease, or otherwise, the ability to correctly identify true negative disease-free individuals. For example, if a diagnostic test has 95% specificity, this means that of all the people who do not have the disease, 95% of people will correctly have a negative diagnostic test result and 5% of people will be incorrectly identified as actually having the disease, also known as a false positive. The following equation can be used to work out specificity:
Specificity = (True Negatives (d)) / (True Negatives (d) + False Positives (b)) x 100
Tests with high specificity are useful in diagnostics because there is a low potential for false positive results. This is important because false positive results can lead to additional stress for the patient and potentially unnecessary and invasive diagnostic follow-up procedures.
Although it is desirable to have a diagnostic test that is both highly sensitive and highly specific, sensitivity and specificity tend to be inversely proportional, which means that as the specificity increases, sensitivity decreases and as sensitivity increases, specificity decreases [2].
The positive predictive value (PPV) and negative predictive value (NPV) are also crucial in evaluating screening and diagnostic tests.
The PPV refers to the probability of the patients who receive a positive test result actually having the disease, or otherwise the probability of an accurate positive test result. For example, if a certain screening test for malignancy has a PPV of 25%, It means that a positive test result is indicative of a 25% chance of having cancer. The following equation can be used to work out PPV:
Positive Predictive Value = (True Positives (a)) / (True Positives (a) + False Positives (b)) x 100
The NPV refers to the probability of the patients who receive a negative test result, correctly not having the disease, or otherwise the probability of a truly accurate negative test result. For example, if a certain screening test for a disease has a NPV of 80%, it means that a negative test result is indicative of an 80% chance of not having the disease. The following equation can be used to work out NPV:
Negative Predictive Value = (True Negatives (d)) / (True Negatives (d) + False Negatives (c)) x 100
Sensitivity and specificity are not influenced by the prevalence of the disease in the population. Conversely, PPV and NPV are influenced by how prevalent the condition is within the population. If a disease is more prevalent, the PPV will increase, because it is more likely that a person will have the disease, however the NPV will decrease because the likelihood of not having the disease will decrease. This is depicted in Figure 1.
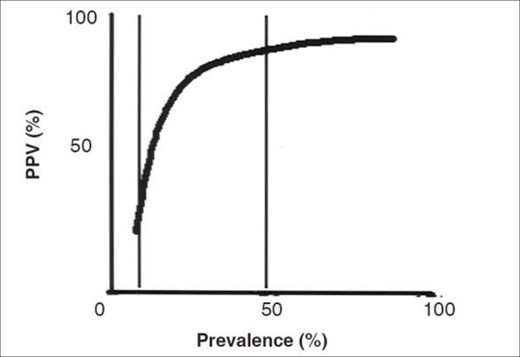
Figure 1: The PPV increases as the prevalence of the disease in the population increases [Reproduced from: Parikh R, Mathai A, Parikh S, et al. Understanding and using sensitivity, specificity and predictive values. Indian Journal of Ophthalmology 2008;56(1):45-50 © Indian Journal of Ophthalmology].
Likelihood ratios are another valuable way to measure how accurate a diagnostic test may be. It merely provides an estimate of how much a test result may alter the odds of having a disease or condition [3].
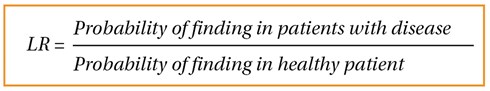
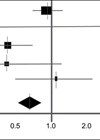
Figure 2.
Figure 2 displays that likelihood ratios compare probabilities of finding, for example, a positive test for patients with the disease and without. Consider patients who suffer from urinary symptoms, who undergo a digital rectal examination; if a nodular prostate is found in 24% of patients who have prostate cancer, and in 16% who don’t. The likelihood ratio here would be 24% over 16% which is equal to 1.5 – the likelihood ratio of a nodular prostate in detecting prostate cancer will be 1.5. Note that this is just an example and does not include any accurate statistics relating to benign prostate hyperplasia. It is commonly taught that a likelihood ratio greater than 1 may suggest that a diagnostic finding is related to a disease, and less than 1 indicates otherwise.
To conclude, this article has focused on the the key elements of accuracy in diagnostic testing.
References
1. Trevethan R. Sensitivity, Specificity, and Predictive Values: Foundations, Pliabilities, and Pitfalls in Research and Practice. Front Public Health 2017;5:307.
2. Shreffler J, Huecker MR. ‘Diagnostic Testing Accuracy: Sensitivity, Specificity, Predictive Values and Likelihood Ratios. StatPearls [Internet] 2021.
3. Mcgee S. Simplifying Likelihood Ratios. Journal of General Internal Medicine 2002;17(8):647-50.
Declaration of competing interests: None declared.