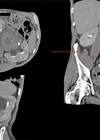
Patients with haematuria require investigations to rule out urinary tract cancer. We know that the most common cancer found during these investigations is bladder cancer, whereas upper tract cancers such as renal cell carcinoma and upper urinary tract urothelial cancer (UTUC) are rarer [1]. Regardless of this, early diagnosis is important to reduce morbidity and mortality.
However not everyone with haematuria has cancer, and investigating everyone with even a trace of haematuria overburdens our resources and can clog up our haematuria clinics, delaying diagnosis of high-risk patients. One way to manage this is to use patient risk markers known to be associated with cancer, to stratify patients, potentially with a tool or risk calculator, and prioritise those with higher risk for investigation first, and lower risk patients can either be discharged or have less invasive screening tests initially.
Guidelines do a good job at broadly stratifying patients [2]; however, these are mainly based on type of haematuria and age and therefore consider only two variables, and do not offer a personalised diagnostic pathway for patients. The investigation of haematuria is not a one-fits-all package. What about personalised prediction tools? There are a few nomograms or tools published [3-7] that risk stratify patients with haematuria. However, these have been subject to selection bias, inappropriate target population and use of a limited number of variables which do not improve much on guideline stratification, and this explains why their limited use in clinical care since publication.
The IDENTIFY study is the biggest international prospective observational study on patients referred to secondary care with suspected urinary tract cancer, mainly haematuria. We included adults aged 16 years and older and excluded patients with a prior diagnosis of any urological malignancy. Within a year we recruited just over 11,000 patients in 110 centres in 26 countries. We published our first paper and reported our primary outcome which was the adjusted prevalence of urinary tract cancers in this population [1]. What made our study unique however, apart from being the largest prospective study in secondary care, was the detail of patient characteristics planned a priori and collected to try and understand the complex interplay of factors related to an individual’s particular risk of cancer.
We have therefore been able to develop a sophisticated model using a mixed effect, multivariable logistic regression that takes into account all relevant patient characteristics that were planned at the protocol level. As our population sample was so large, we had adequate numbers of cancers, or ‘events’ to enable construction of a complex prediction model with a larger number of variables than previous published models, with less risk of overfitting (where a model is too specific to its cohort and not generalisable enough).
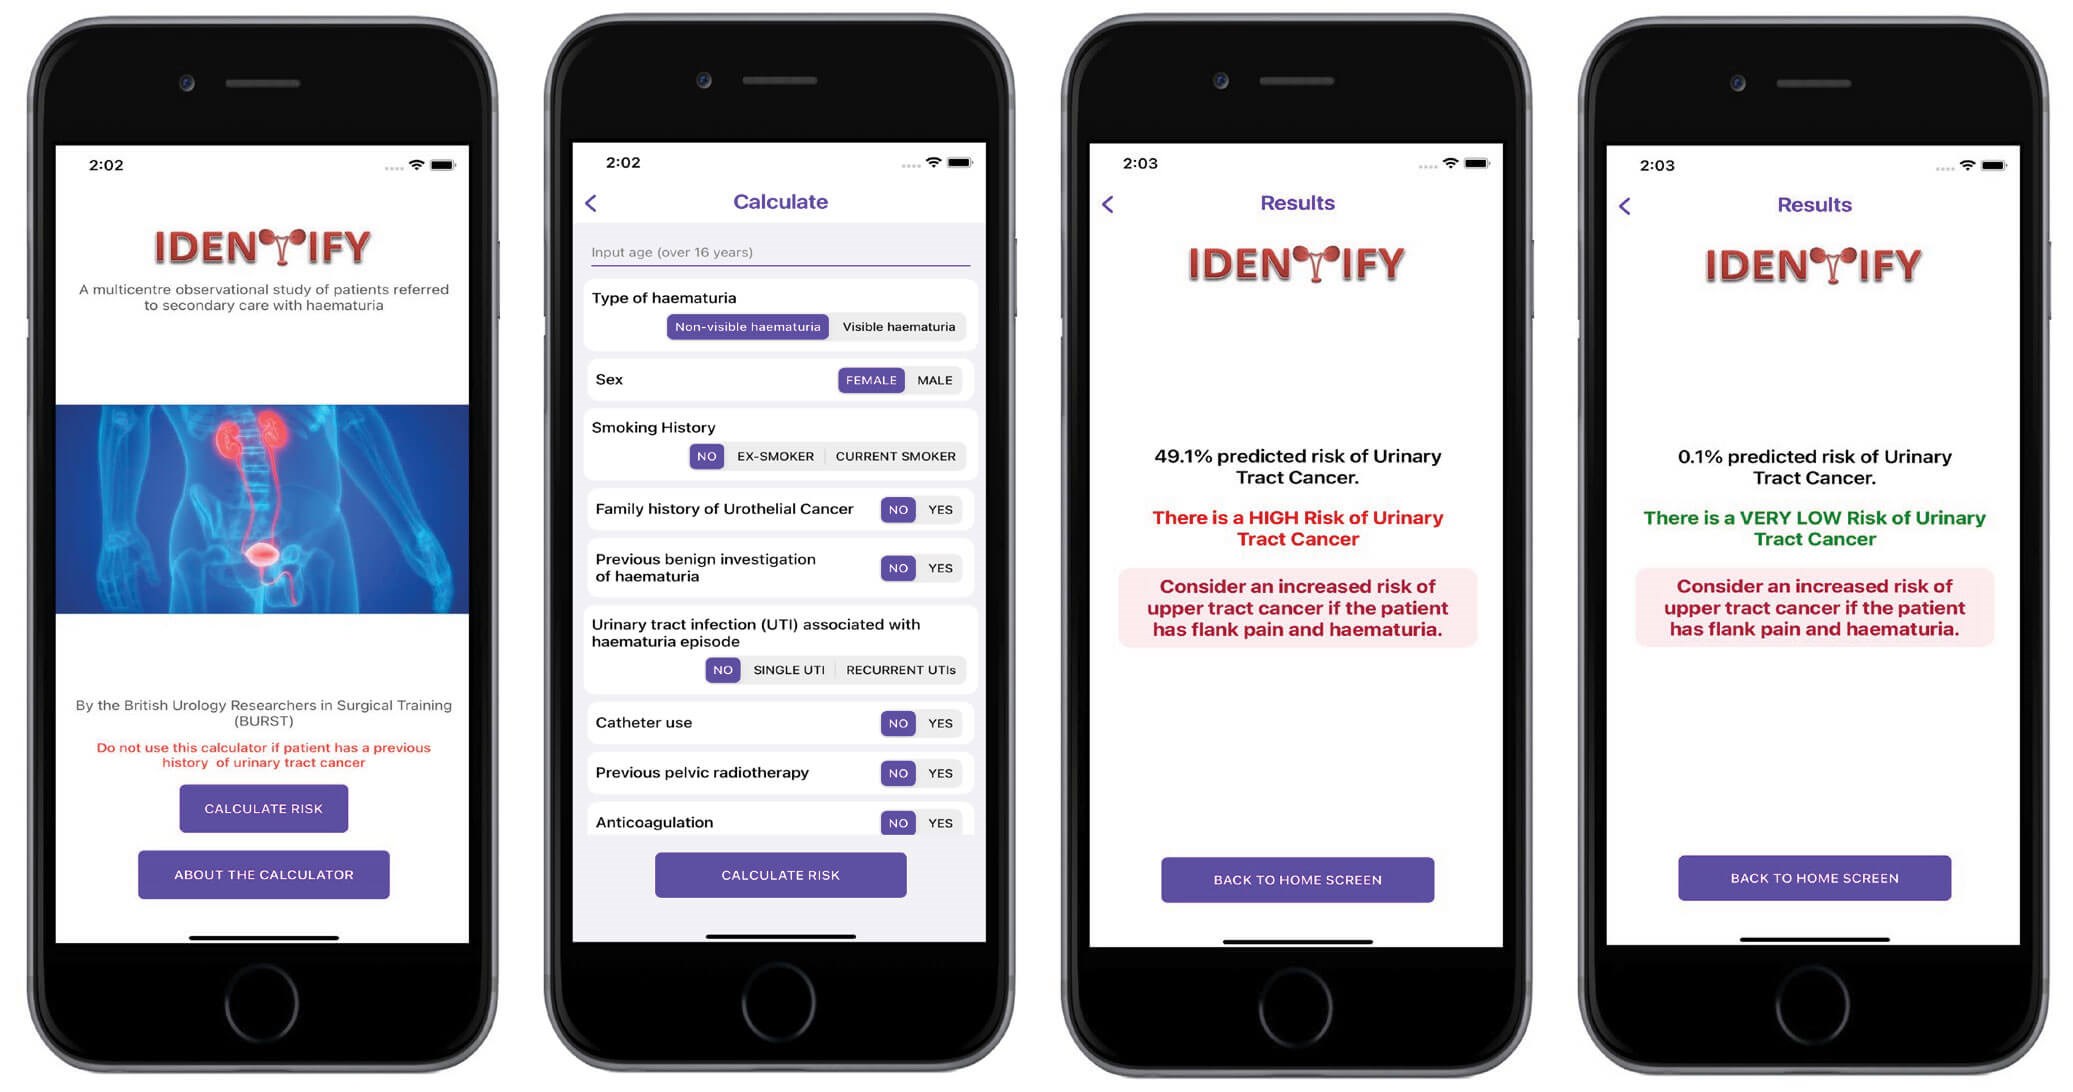
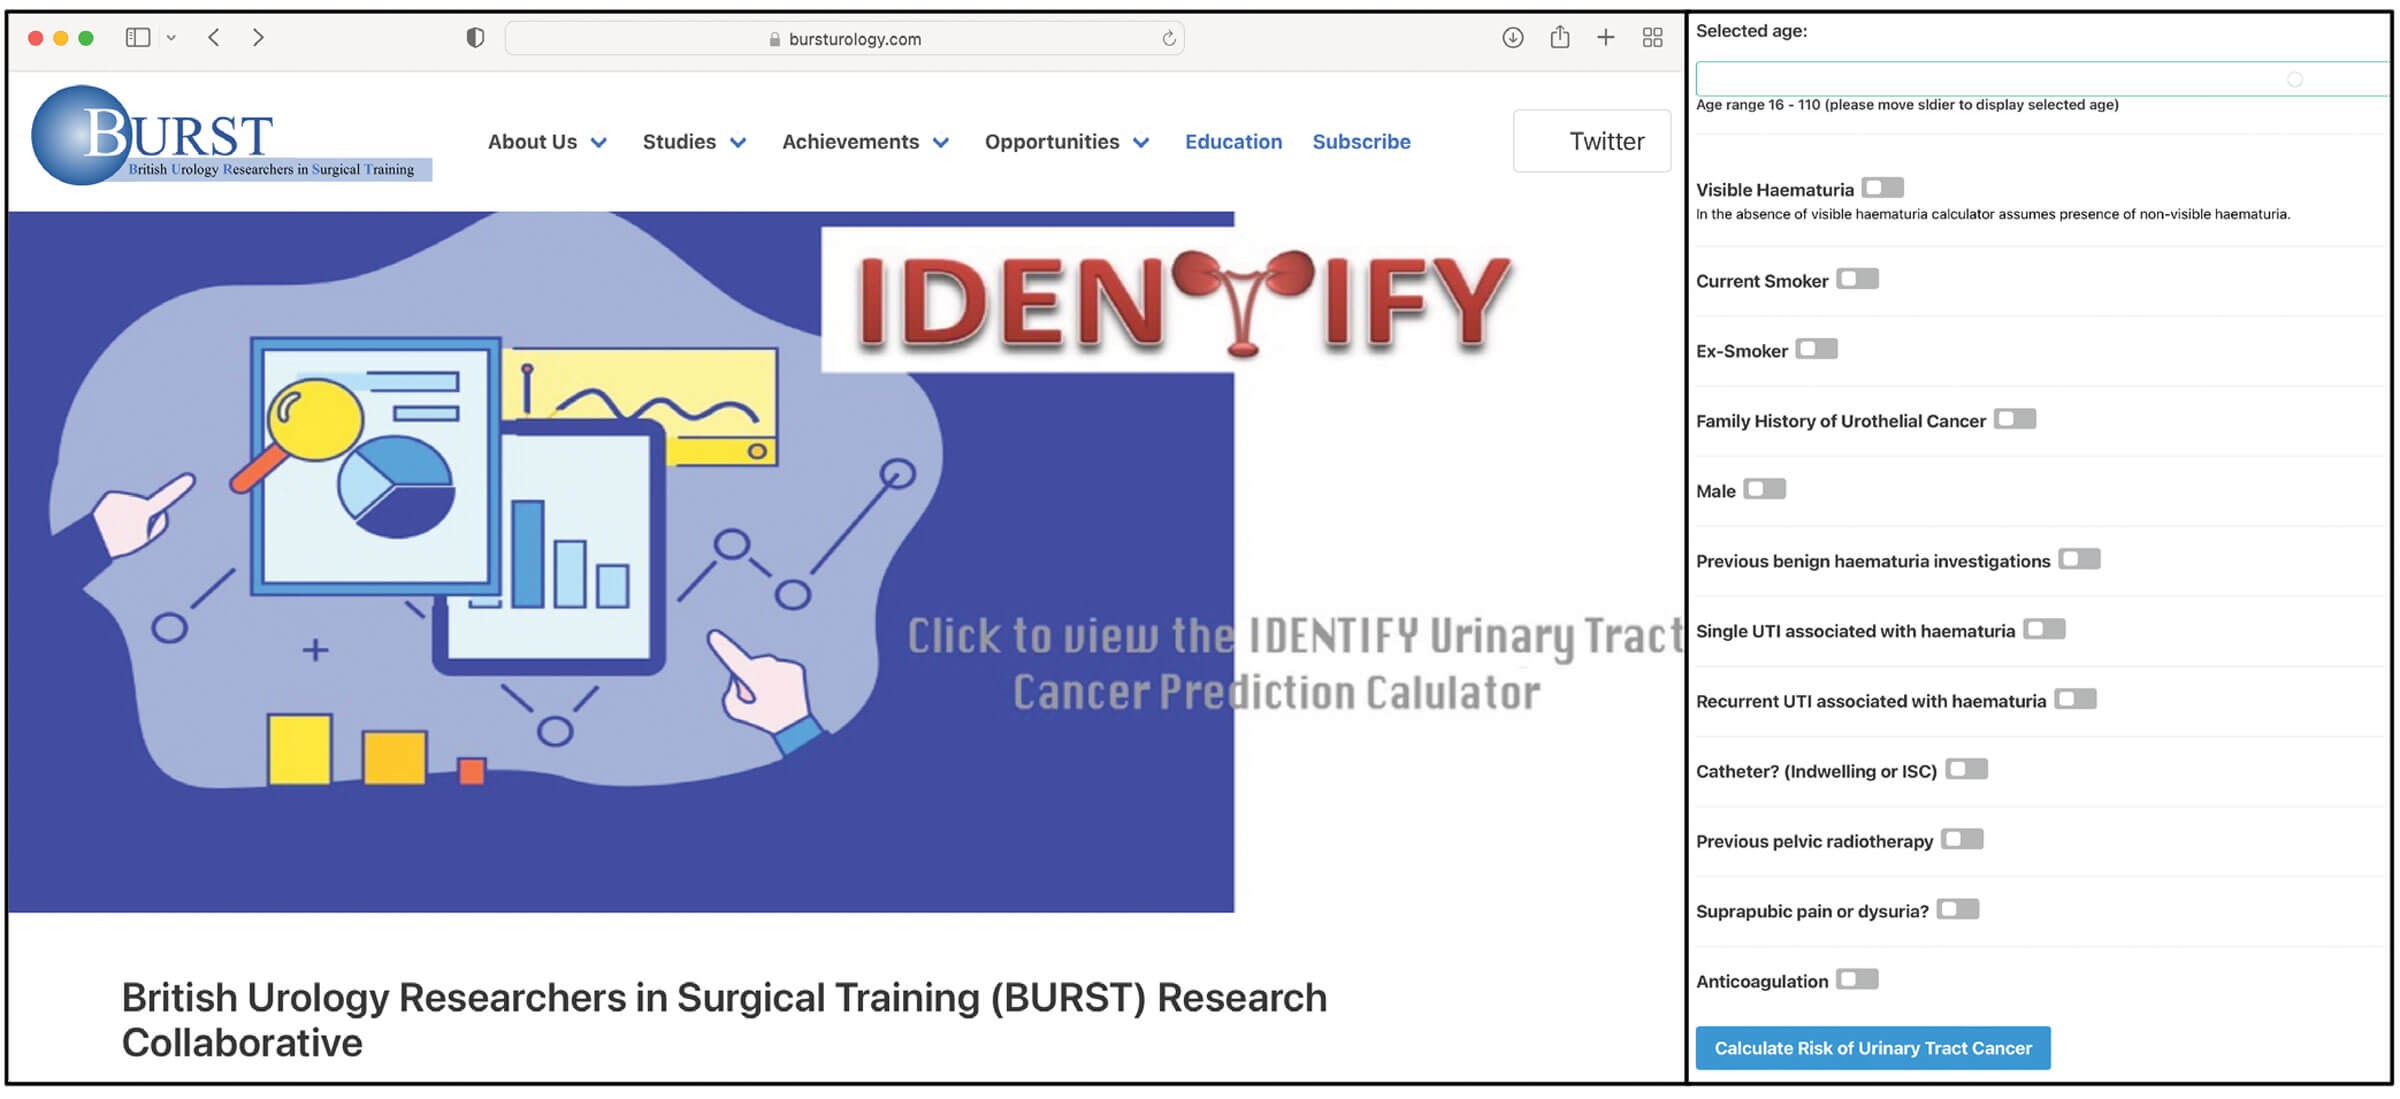
We found in our regression model that there were variables associated with increased risk of cancer, the greatest being visible haematuria and age, and variables associated with a decreased risk of cancer, amongst which were catheter use, urinary tract infections (UTIs) and anticoagulation.
The performance of the model, as measured by area under the curve was very good at 86%.
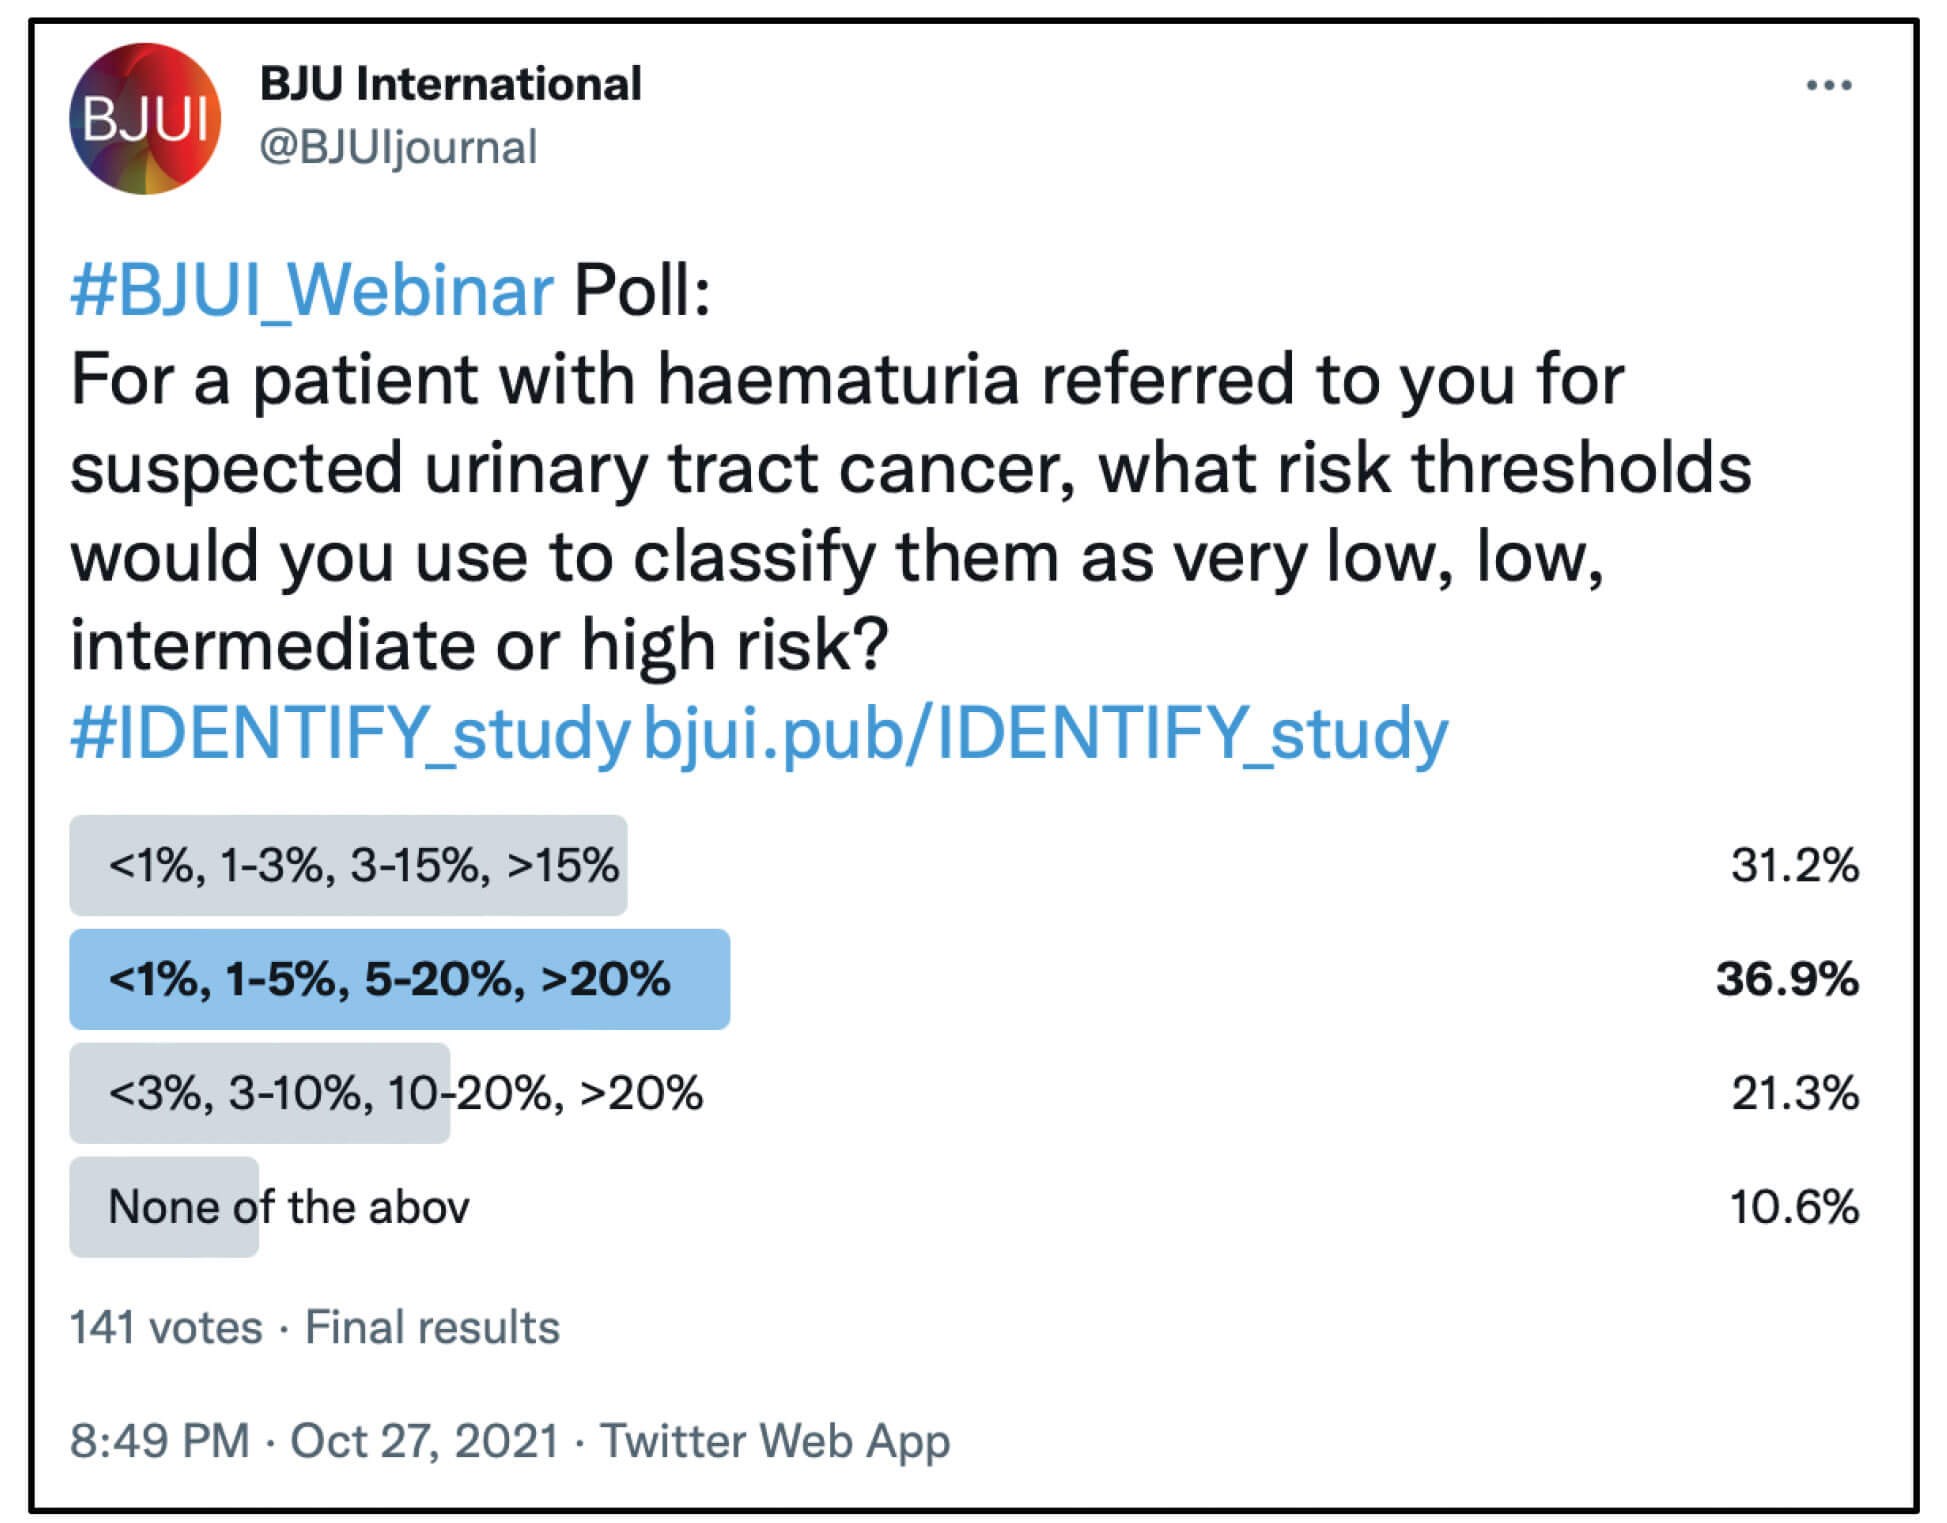
So how can this risk calculator be used? The clinician can use a patient’s percentage risk to discuss with them their risk and what investigations they may want as a result. As a guide however, we created risk categories based on clinical judgement and recommended that less than 1% is very low risk, low risk is 1 to 5%, medium is 5 to 20%, and over 20% is high risk. This was also supported by a BJUI twitter poll undertaken by urologists.
The patient and clinician can however decide their own thresholds because the calculator outputs the exact predicted percentage, not just a risk category.
Another important consideration of prediction tools is their usability. In today’s digital age an accurate computerised online tool is far more practical to use. So, we have added the IDENTIFY risk calculator to our website and made it into an app on Apple and Android. Finally, an integral step in prediction models is external validation. This is important to show that the model is generalisable and works in a different population from which it was developed. We have undergone this process in a separate cohort of 3500 patients referred with haematuria to secondary care, and preliminary results show good performance of the model in predicting cancer in the validation cohort. The final results will be published soon.
References
1. Khadhouri S, Gallagher KM, MacKenzie KR, et al. The IDENTIFY Study: The Investigation and Detection of Urological Neoplasia in Patients Referred with Suspected Urinary Tract Cancer; A multicentre observational study. BJU Int 2021;128(4):440-50.
2. National Institute for Health & Care Excellence (NICE). Suspected cancer: recognition and referral: NICE guideline [NG12]. London, UK; NICE; 2015.
3. Tan WS, Ahmad A, Feber A, et al. Development and validation of a haematuria cancer risk score to identify patients at risk of harbouring cancer. J Intern Med 2019;285(4):436-45.
4. Tan GH, Shah SA, Ann HS, et al. Stratifying patients with haematuria into high or low risk groups for bladder cancer: A novel clinical scoring system. Asian Pacific J Cancer Prev 2013;14(11):6327-30.
5. Matulewicz RS, Rademaker A, Meeks JJ. A simplified nomogram to assess risk of bladder cancer in patients with a new diagnosis of microscopic hematuria. Urol Oncol Semin Orig Investig 2020;38(4):240-6.
6. Loo RK, Lieberman SF, Slezak JM, et al. Stratifying risk of urinary tract malignant tumors in patients with asymptomatic microscopic hematuria. Mayo Clin Proc 2013;88(2):129-38.
7. Cha EK, Tirsar LA, Schwentner C, et al. Accurate risk assessment of patients with asymptomatic hematuria for the presence of bladder cancer. World J Urol 2012;30:847-52.