Introduction
The adrenal glands are seen on CT or MRI surrounded by fat in the peri-renal space. The right adrenal gland lies medial to the right lobe of the liver, lateral to the right crus of the diaphragm and superior to the right kidney. The left adrenal gland lies medial and anterior to the upper pole of the left kidney, lateral to the left crus of the diaphragm and posterior to the pancreas.
Adrenal glands are seen on CT in the shape of an inverted ‘V’ or ‘Y’ with a body and a medial and lateral limb (Figure 1). Each limb is smooth in outline and should be uniform in thickness, measuring 5-7mm, and the adrenal should measure up to 3cm in length.
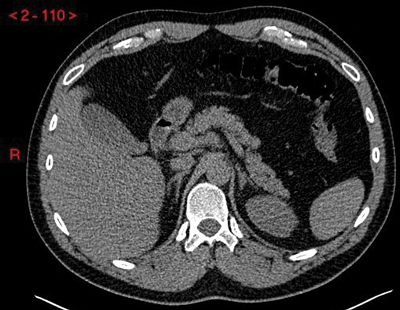
Figure 1: Unenhanced CT demonstrating normal anatomical position and inverted ‘Y’ shape of the adrenal glands.
Adrenal lesions are a commonly encountered incidental finding on imaging and are seen in over 4% of CT scans [1-3]. The vast majority of these will be benign adenomas, but it is important to be vigilant when assessing each one to make sure that a malignant lesion is not missed. Features that raise the suspicion for malignancy include larger size (> 3cm), irregular margin, heterogeneity and lack of intra-lesional fat. If a lesion is malignant, then it is most likely to be a metastasis from lung, breast, kidney, melanoma or colonic primary. Less commonly encountered lesions include myelolipomas, primary adrenal cell carcinomas and phaeochromocytomas. Mild adrenal thickening is also a common finding on CT or MRI, and smooth enlargement is seen as diffuse thickening of the adrenal gland with a limb thickness >6-8mm rather than as a focal nodule. Thickening of the adrenal gland should not be interpreted as an early sign of metastatic disease, even in patients with a known primary malignancy.
“The two most common imaging modaalities used to assess indeterminate adrenal lesions are multi-phase IV contrast-enhanced CT scanning and multi-sequence MRI scanning.”
Imaging methods
The two most common imaging modalities used to assess indeterminate adrenal lesions are multi-phase IV contrast-enhanced CT scanning and multi-sequence MRI scanning. Radiology departments vary on which method they choose depending on modality preference and capacity. If an adrenal lesion is detected incidentally on a CT scan, then it can often be classified as benign based on this initial scan. Eighty percent of adrenal adenomas have a high level of microscopic (intra-cytoplasmic) fat and will therefore have low Hounsfield units (HU). On an unenhanced CT scan, a lesion with an average HU <10 will have a sensitivity of 71% and a specificity of 98% for adenoma [4] (Figure 2). If the lesion has an average HU of >10 then adrenal-specific imaging will need to be performed to determine whether the lesion is a ‘lipid-poor’ adenoma or whether it is a malignant lesion.
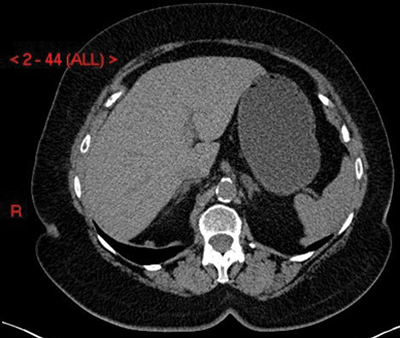
Figure 2: Adenoma on unenhanced CT shown as a well-defined left adrenal nodule with HU <10.
Adrenal protocol CT scanning
CT can detect lesions as small as 5mm and is the first-line imaging modality. This method utilises the different enhancement characteristics of benign and malignant lesions to make a diagnosis. Images are acquired at three different stages of enhancement; unenhanced, one-minute post-IV contrast and 10-minutes post-IV contrast. Adenomas characteristically show rapid enhancement and rapid washout. Malignant lesions can also show rapid enhancement, but they show much slower washout rates. This is because they have disordered capillary permeability, which results in prolonged retention of contrast material. Lesions can therefore be classified as either benign adenomas or malignant lesions based on contrast washout rates.
The absolute washout rate is calculated using the following formula:
- (E – D / E – U) x 100
where E is the HU on the early post-IV contrast scan, D is the delayed scan and U is the unenhanced scan. A cut-off of >60% has been shown to diagnose a benign adenoma with a sensitivity of 88% and a specificity of 96% [5] (Figure 3).
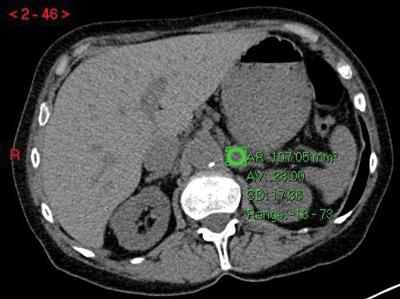
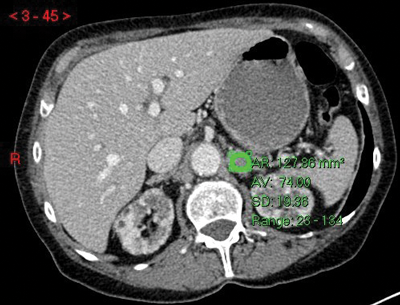
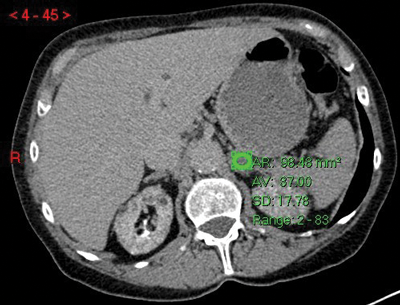
Figure 3:
Top: Unenhanced CT (HU 23).
Centre: Arterial phase CT (HU 74).
Bottom: Delayed phase CT (HU 37).
Absolute washout = (74-37)/(74-23)x100 = 37/51x100 = 72.5% in keeping with adenoma.
If an unenhanced scan is not obtained, then relative washout can be calculated instead using the following formula:
- (E – D / E) x 100
A relative washout of >40% has been shown to have 96% sensitivity and 100% specificity for adenoma [5].
Adrenal protocol MRI scanning
The commonly encountered adrenal lesions typically have very characteristic fat compositions; no fat in malignant lesions, macroscopic fat in myelolipomas and microscopic fat in adenomas. This can be exploited by specific MRI scanning protocols to make a diagnosis. Under normal circumstances, the dipoles of each positive ion in the body all spin in random directions. When a patient is placed in the MRI scanner, these positive ions will then move into alignment with the magnetic field. Prior to image acquisition, radiofrequency pulses are released at right-angles to the magnetic field, knocking the positive ions out of alignment. Following the radiofrequency pulses, the positive ions will return to alignment with the magnetic field and in doing so, release specific energies that can be measured and used to formulate an image. The type and timing of the radiofrequency pulses and the timing of the image acquisition can be varied to highlight different tissue characteristics.
Frequency selective fat suppression techniques (e.g. short tau inversion recovery (STIR)) work by timing the acquisition of the images at a point when macroscopic fat does not return a signal. Areas of macroscopic fat will therefore be of low signal on these sequences and isodense to intra-abdominal fat on T1 and T2 images. If this is seen in an adrenal lesion then a diagnosis of myelolipoma can confidently be made (Figure 4).
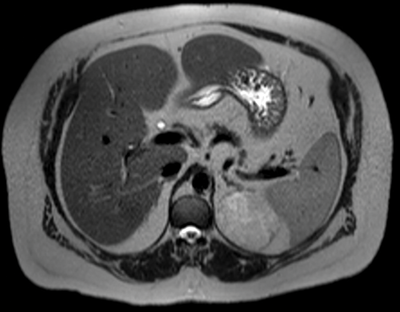
Figure 4: Myelolipoma seen as isodense to fat on T2 image.
However, the presence or absence of macroscopic fat does not differentiate between the two most common diagnoses of adenoma and metastasis. To make this distinction on MRI, it is necessary to use opposed phase (chemical shift) techniques to assess for microscopic fat. This technique works on the principle that positive ions in the body are, to some extent, affected by the composition of the surrounding atoms. In particular, it makes use of the fact that the resonant frequency of these positive ions is fractionally higher when the positive ion is in fat than when it is in water.
In opposed phase MRI scanning techniques, one image is obtained when the dipoles of the positive ions in fat and water are ‘in-phase’ with each other and another is obtained when the dipoles are ‘out of phase’ with each other. These two images can then be processed to assess for the presence of microscopic (intracytoplasmic) fat. On in-phase imaging, adrenal lesions tend to be iso-intense to the spleen. On opposed phase imaging, adrenal lesions containing microscopic fat will lose signal relative to the spleen. This is seen with adrenal adenomas and not with adrenal metastases (Figure 5).
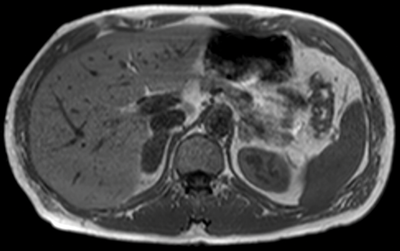
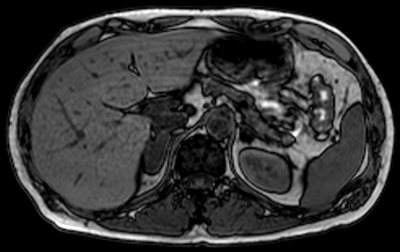
Figure 5:
Top: MRI in-phase.
Bottom: MRI out-of-phase demonstrating loss of signal in left adrenal lesion in keeping
with an adenoma, but no loss of signal in the right adrenal lesion, due to metastasis.
Other rarer diagnoses do not usually cause diagnostic uncertainty. Primary adrenal cell carcinomas tend to be very large and heterogeneous at the time of diagnosis. Phaeochromocytomas can have a varied appearance, but they are usually strongly suspected based on clinical history and the detection of urinary catecholamines.
Limitations in adrenal imaging
There will always be exceptions to each rule, for example a malignant tumour that contains some fat, or a benign adenoma with very little fat, but these are so rare that they should not have an impact on departmental scanning protocols or individual reporting methods. The main downside to the imaging of these lesions is that it cannot assess for functionality. It is therefore essential that these lesions are not only assessed radiologically, but also with the appropriate biochemical markers.
Conclusion
Adrenal lesions are a commonly encountered incidental finding on imaging. Many of these can be classified as benign adrenal adenomas on the initial scan, but for the indeterminate lesions, adrenal-specific CT or MRI scanning techniques can be performed to help make a diagnosis.
References
1. Bovio S, et al. Prevalence of adrenal incidentaloma in a contemporary computerized tomography series. J Endocrinol Invest 2006;29(4):298.
2. Barzon L, Sonino N, Fallo F, et al. Prevalence and natural history of adrenal incidentalomas. Eur J Endocrinol 2003;149:273-85.
3. Song JH, Chaudhry FS, May-Smith WW. The incidental adrenal mass on CT: prevalence of adrenal disease in 1,049 consecutive adrenal masses in patients with no known malignancy. AJR Am J Roentgenol 2008;190:1163-8.
4. Blake MA, Holalkere NS, Boland GW. Imaging techniques for adrenal lesion characterization. Radiol Clin North Am 2008;46(1):65-78.
5. Korobkin M, et al. CT time-attenuation washout curves of adrenal adenomas and nonadenomas. AJR Am J Roentgenol 1998;170:747-52.
6. Farr F. Physics for medical imaging. 2nd edition. Elsevier; 2008.